Community Health Needs Assessment for the Greater Brockton GBHA
Prepared for:
Prepared by:

December 2010
Acknowledgements
The completion of this assessment would not have been possible without the enthusiastic participation of community organizations and residents in each GBHA city and town. We would like to thank the residents who shared their thoughts on health in their communities and the key informants who graciously provided their time and expertise. We would also like to thank the following organizations:
Organizations Hosting Community Impressions Sessions
Activate Easton
Brockton Neighborhood Health Center
Brockton Parents’ Academy
Lincoln Technical Institute
Self-Help, Inc. in collaboration with the Cape Verdean Association
Signature Healthcare Brockton Hospital
Stoughton Council on Aging Organizations Hosting Anonymous Question Boxes
Avon Town Hall
Bridgewater Public Library
Curves Gym, Whitman
Holbrook Public Library
Planet Fitness, West Bridgewater
Signature Healthcare Brockton Hospital office in Abington
Striar Branch of the Old Colony YMCA, Stoughton
Walgreens, Brockton and Whitman
A special thanks to the Greater Brockton GBHA Community Health Assessment Subcommittee, who provided valuable advice, dedication, and guidance during the assessment process:
Linda Barros, Self-Help, Inc.
Bonnie Black, Lincoln Technical Institute
Ruth Blais, Salvation Army
Amy Bourkiche, Stoughton Youth Commission/Council on Aging
Nancy DeLuca, Signature Healthcare Brockton Hospital
Jean-Paul Despres, South Bay Mental Health
Mary Eager, Salvation Army
John Eastman, Self-Help, Inc.
Matt Elliott, Lincoln Technical Institute
Maria Evora-Rosa, Massachusetts Department of Public Health
Hilary Lovell, Signature Healthcare Brockton Hospital
Kerrin Miniutti, Lincoln Technical Institute
Robert Retalic, Lincoln Technical Institute
Robert Short, Caritas Good Samaritan Hospital
Teresa Tapper, Stoughton Youth Commission/Council on Aging
Brenda Viveiros, BMC Health Net Plan.
Introduction
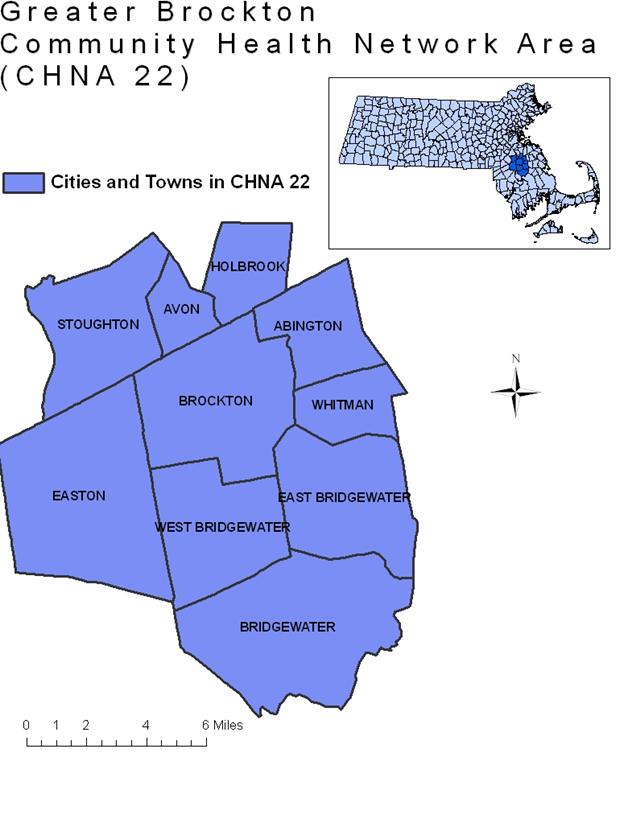
Community Health Network Areas (GBHAs) are coalitions of agencies in the public, non-profit, and private sectors working together to build healthier communities in Massachusetts through community-based prevention, planning, and health promotion. The Massachusetts Department of Public Health established the Community Health Network Area (GBHA) effort in 1992. Today this initiative involves all 351 towns and cities through 27 Community Health Networks. The Greater Brockton GBHA serves the towns of Abington, Avon, Bridgewater, Brockton, East Bridgewater, Easton, Holbrook, Stoughton, West Bridgewater, and Whitman. When the term “GBHA” is used in this report, it refers to the Greater Brockton GBHA unless otherwise specified.
The mission of the GBHA is to work toward healthier communities by promoting collaboration between GBHA partners, providing support to local health initiatives and prevention programs, and educating and increasing awareness of local identified health issues throughout the communities it serves.
The guiding principles of the GBHA include:
- Diversity Awareness
- Collaboration
- Continuity of GBHA
- Decrease duplication of services
- Prevention focus
- Support for all ten GBHA communities
- Meet community needs
- Communication
- Flexible participation respecting members’ time
With the mission and the GBHA guiding principles in mind, the Southeast Center for Healthy Communities conducted this community health assessment for the GBHA to uncover community health needs, identify vulnerable community groups, and determine gaps in community health programming.

Executive Summary
The Southeast Center for Healthy Communities conducted this Community Health Needs Assessment for the Greater Brockton Community Health Network Area (GBHA) with the goal of identifying unmet community health needs, vulnerable populations, and gaps in existing community health services. This needs assessment used a five-pronged approach to address these areas: 1) conducting community impressions sessions mainly with Brockton residents to examine their perceptions of social determinants of health and health problems in the area, 2) analyzing existing data to determine how health outcomes in the city of Brockton and surrounding towns differ from the state’s overall numbers, 3) administering anonymous surveys for residents through boxes located in area towns, 4) reviewing existing programs and services in the area to determine gaps, and 5) conducting key informant interviews with people who work in GBHA towns other than Brockton to discover how the needs of residents of area towns compare to the needs of residents inside the city.
Summary of Findings
Findings from each piece of the assessment contribute to the overall picture of area health needs in different ways. Examining results from the community impressions sessions and anonymous surveys will give the GBHA an indication of how community residents experience health care services, perceptions about the largest health problems, risk behaviors in these communities, and problems with health care access. Examining available programs and services in the area will allow the GBHA to determine gaps in local services. Examining results from the archival data analysis will allow the GBHA to determine whether hospitalization, emergency department utilization, or mortality in this region for conditions such as heart disease, injuries, asthma, diabetes, and substance use are comparable to state levels. It will also allow the GBHA to examine social determinants of health such as poverty, housing and homelessness, and community safety. Finally, examining results of the key informant interviews will give the GBHA a non-Brockton perspective on how the residents of the other GBHA towns perceive their largest health issues and community assets. The GBHA will also be able to examine which issues cut across communities and which issues might be community-specific.
Archival Data Analysis
An initial review of the data uncovered the fact that the city of Brockton has a different demographic structure and different health outcomes from the GBHA overall. Due to these differences, two different sets of local data are presented in the text of this report: one comparing health outcomes for the city of Brockton to Massachusetts, and one comparing health outcomes for the rest of the GBHA overall (not including Brockton) to Massachusetts. For some data sources, it was not possible to separate the city of Brockton from the rest of the towns in the GBHA when analyzing data; in those cases, we present data for the GBHA overall including Brockton. Where the towns have been separated from Brockton, the data is named “Other GBHA Towns.” Through separating the city of Brockton from the remainder of the GBHA, this assessment may align itself with the GBHA’s guiding principle of “support for all ten GBHA communities.”
Highlights of the archival data analysis include:
Demographics:
- The city of Brockton has considerably more racial and ethnic diversity than the rest of the GBHA or the state. Additionally, just under one-quarter of the residents of Brockton were born outside the United States, compared to approximately 14% of residents of the state overall, and just over one in four residents of Brockton speak a language other than English in the home.
- One in three people in the city of Brockton and one in ten people in the other GBHA towns is living in a household with an income that is below 200% of the federal poverty level.
Housing and Homelessness:
- Brockton was the community in the state with the most distressed properties (defined as properties with a foreclosure petition filed within the past year, an auction has been scheduled, or is bank-owned), 41.8 per 1,000 housing units, on April 1, 2010.
- Approximately 900 people were homeless in Plymouth County according to a point-in-time count of the population in January, 2010.
Health Care Access:
- Caritas Good Samaritan Medical Center had the eighth highest number of interpretation sessions in Massachusetts in 2007.
- The age-adjusted rate of emergency room usage was higher in the city of Brockton than in the state overall from 2006-2008, while the age-adjusted rate of emergency room usage in GBHA towns, other than Brockton, was lower than the state rate during the same time period.
Safety:
- From 2005 through 2007, almost half of the assault-related weapons injuries in the GBHA (including Brockton), where the location of the incident was known, occurred on the streets.
- The assault-related gunshot or sharp instrument injury rate in the city of Brockton in 2008 (92.4 per 100,000) was over three times the state rate of 30.1 per 100,000.
Substance Use and Behavioral Health:
- From 2005-2007, the opioid-related fatal overdose rate in the city of Brockton (15 per 100,000) was significantly higher than the state rate (9 per 100,000).
- For young adults age 20-24, Avon, Whitman, Holbrook, Stoughton, East Bridgewater, Brockton, and Abington had higher rates of admission to BSAS facilities for all substances than the state rate in 2007.
- Both the city of Brockton and the GBHA towns other than Brockton had a higher rate of alcohol and other drug-related hospital discharges than the state overall from 2006-2008.
Maternal and Child Health:
- The overall teen birth rate for the city of Brockton (44.2 per 1000 women age 15-19) was significantly higher than the state overall (21.1 per 1000). The teen birth rate for other GBHA towns (10 per 1000) was approximately half the state total. The birth rate for Black non-Hispanic women age 15-19 in the city of Brockton (47.1 per 1000) was also significantly higher than the birth rate for non-Hispanic Black women in the state overall in the same age group (33.8 per 1000).
- None of the communities in the GBHA has water fluoridation, which has implications for oral health.
- The percentage of children with elevated blood lead levels in the city of Brockton (4.1%) was significantly higher than the percentage of children in the state overall (1.8%).
HIV/AIDS:
- From 2005-2007, Brockton was the tenth highest city for average annual diagnosis rate of HIV in Masssachusetts, and as of 2008, Brockton had the eleventh highest rate of people living with HIV/AIDS in the state.
- Non-Hispanic Black residents of Brockton have been disproportionately affected by HIV/AIDS. While 31.1% of the city’s residents identify as non-Hispanic Black according to the Massachusetts Department of Public Health, 64% of newly diagnosed cases of HIV/AIDS in Brockton were in non-Hispanic Black residents.
Risk Behaviors and Health Screening:
- An estimated one in five adults is a current smoker in two towns in the GBHA: Brockton and Whitman. The lowest estimated rate of smoking in the GBHA is in Easton (13.8%) and Stoughton (15.3%).
- The GBHA (including the city) had a significantly lower percentage of residents who reported that they consumed at least five servings of fruits or vegetables per day than the state overall from 2007-2009.
Chronic Illnesses:
- The city of Brockton and the other GBHA towns overall each had a higher rate of hospitalization for diabetes than the state overall from 2006-2008.
- The city of Brockton had a higher prevalence of lifetime asthma among children in kindergarten through grade 8 (15%) than the state overall (11%) during the 2006-2007 school year.
- Race/ethnicity disparities exist in the GBHA for emergency department visits for asthma. Black non-Hispanic residents and Hispanic residents each had a higher rate of emergency department visits for asthma than non-Hispanic White residents. The pattern was the same for asthma-related emergency department visits for children age 0-9.
- Women in the city of Brockton had a lower incidence of invasive breast cancer than women in the state overall from 2003-2007. Women in the city had a higher incidence of cervical cancer than women in the state overall for the same time period. Women in other GBHA towns had a higher incidence of lung cancer than women in the state overall during the same time period.
Community Impressions Sessions
In addition to statistics, GBHA members were also interested in perceived health concerns among community members. An ad hoc Community Assessment Subcommittee was formed to discuss ways to collect this feedback from community members. The subcommittee decided to show the film “Place Matters,” a 29-minute segment of the “Unnatural Causes” DVD series, to community members to stimulate thought about social determinants of health. Subcommittee members then decided to follow the film with informal conversations with community members to determine which health concerns were most pressing for residents of the GBHA. All but two of these impressions sessions occurred inside the city of Brockton; therefore, health problems and social determinants of health that emerged as themes from these sessions can be considered largely Brockton-centric.
Health problems that emerged as themes from these community impressions sessions included:
- Mental health issues including stress and depression;
- Violence;
- Asthma, including both adults and children;
- Diabetes;
- Hypertension;
- Obesity;
- Lack of sleep;
- Substance use, including injection drugs and alcohol.
Social determinants of health that emerged as themes from these community impressions sessions included:
- Poverty, including issues such as the economic downturn, parents working multiple jobs, inability to afford health insurance or having insurance with high copayments, and people being unable to qualify for services due to having an income just above the guidelines;
- Issues with housing, such as perceiving housing as unaffordable, of poor quality, and overcrowding;
- Lack of community cohesion, including issues such as people not knowing one another in neighborhoods and residents perceiving that that the “village raises a child” mentality no longer exists;
- Mental health issues, including worries about unemployment or underemployment, the economy, single parenthood, working multiple jobs, and fear for safety due to drug and gang activity;
- Neighborhood safety including issues such as street violence;
- Eating unhealthy foods due to inability to afford healthy food or low-quality produce available in local supermarkets;
- Barriers to physical activity such as the expense of after-school activities for children, parents not wanting to let children outside with needles and trash on the ground, “stranger danger,” and playgrounds in poor condition.
Key Informant Interviews
In order to obtain a more sizeable amount of information from the communities outside of Brockton, the Greater Brockton GBHA Community Health Assessment Subcommittee identified key informants in each of the nine surrounding towns to be interviewed about health concerns in those communities. Two key informant interviews were conducted per town. Due to confidentiality constraints, individual key informants are not identified in this report.
Major themes among health problems identified by key informants outside of Brockton include:
- Childhood asthma, which tends to be better-controlled among the high-school-age population;
- Substance use among adolescents—though key informants stated it was not present in a large number of kids, it is problematic in some;
- Mental health problems among people of all ages, but particularly adolescents;
- Substance use and alcohol abuse among people of all ages;
- Childhood obesity;
- Lack of exercise both among children and adults;
- Type II diabetes in adults;
- Obesity in adults;
- Life-threatening allergies in children;
- Lyme disease;
- Oral health problems;
- Tuberculosis—infected people from outside the US;
- Dementia and Alzheimer’s disease in older adults;
- Cardiovascular disease such as hypertension.
Major social determinants of health identified by key informants outside of Brockton include:
- Worsening economic situation of community members, including subtle signs of poverty or people trying to maintain exterior lifestyle while needing economic assistance behind-the-scenes;
- Lack of access to health care due to issues such as high copayments, services that Medicare and Medicaid won’t cover, people not obtaining insurance due to tax penalty being cheaper for them, and difficulty navigating the health care system;
- Parents are busy working and experience much stress as a result, so they have no time to prepare healthy meals;
- Lack of mental health providers for adolescents; lack of mental health providers overall in particular towns;
- Lack of public transportation in Whitman, West Bridgewater, Abington, and Easton;
- Cuts to health education and other preventive programs due to budget shortfalls;
- Lack of dental insurance or dentists who accept MassHealth;
- Lack of sidewalks or sidewalks in poor condition;
- Lack of well-care clinic in certain towns due to funding cuts.
Community Assets, Programs, and Services
Community members and key informants both identified assets to their communities and ways that local officials may help residents remain healthy. Lists of these assets are found in the summaries of key informant interviews and community impressions sessions; an additional list of programs and services gleaned from local resource guides and community members may be found on page 71. In addition, the key informants also provided their thoughts on health problems for which they would like to see additional resources in GBHA communities located outside of Brockton; a list of these may be found on page 69.
Methodology
The initial focus areas of the assessment were determined through consulting with the steering committee and the GBHA general membership. This was done through presentation of the film “Place Matters,” an initial data presentation to the general membership of the GBHA, and a discussion of social determinants of health. The GBHA general membership then indicated which topics they’d like to know more about. The following data areas of interest emerged:
- Chronic diseases such as asthma, diabetes, and HIV/AIDS;
- Race/ethnicity health disparities;
- Poverty;
- Health literacy;
- Violence;
- Homelessness;
- Access to transportation;
- Unemployment;
- Disability;
- Linguistic and cultural barriers to accessing health care;
- Mental health;
- Adolescent health issues such as sexually transmitted infections and pregnancies.
In addition to statistics, GBHA members were also interested in perceived health concerns among community members. The community health assessment thus consisted of a multi-pronged effort including:
- Analysis of existing statistical data;
- Conversations with community groups about local health concerns;
- Written data collection through anonymous question boxes left in local libraries, town halls, and fitness centers;
- Key informant interviews with providers in GBHA towns other than Brockton;
- An analysis of existing health care services in the area and potential areas of need for additional services.
Existing statistical data was taken from federal, state, and local sources. Federal and state data sources included the U.S. Census Bureau for population, demographic, and socioeconomic characteristics for each town; the Massachusetts Department of Public Health’s Community Health Information Profile (MassCHIP), for behavioral health data, birth data, mortality data, hospitalization data, and emergency department data; and the Massachusetts Behavioral Risk Factor Surveillance System (BRFSS), for self-reported risk behavior and health screening data. More detailed information about each data source can be found in Appendix A.
The following organizations and people were instrumental in gathering additional local data of interest: Heather Arrighi and Sandra Blatchford of the Plymouth County District Attorney’s Office provided domestic violence and crime statistics; Dennis Carman and Joyce Tavon of the Plymouth County United Way provided statistics regarding homelessness; Kathy Rodriguez of the Massachusetts Family Literacy Consortium provided statistics regarding school completion and literacy; Koren Cappiello of the Brockton Mayor’s Office provided opiate overdose statistics; and Robert Short of Caritas Good Samaritan provided statistics concerning Brockton-area health outcomes from the Caritas Good Samaritan Community Health Assessment.
For the archival data analysis, data from the GBHA was compared to state level data to determine significant differences. When describing the data, the terms “higher than” or “lower than” were used only when the rate of a given health outcome in the GBHA or city was significantly different from the state. When available, three years of data were analyzed together to provide more stable estimates than using one year of data alone. Statistical significance means that the difference between two groups is most likely not due to random chance. Statistical significance was determined by comparing the GBHA rate to the state rate using 95% confidence intervals. For additional common statistical definitions used in this report, please see Appendix B.
An initial review of the data uncovered the fact that the city of Brockton has a different demographic structure and different health outcomes from the GBHA overall. Due to these differences, two different sets of local data are presented in the text of this report: one comparing health outcomes for the city of Brockton to Massachusetts, and one comparing health outcomes for the rest of the GBHA overall (not including Brockton) to Massachusetts. For some data sources, it was not possible to separate the city of Brockton from the rest of the towns in the GBHA when analyzing data; in those cases, we present data for the GBHA overall including Brockton. Where the towns have been separated from Brockton, the data is named “Other GBHA Towns.” By separating the city of Brockton from the remainder of the GBHA, this assessment may align itself with the GBHA’s guiding principle of “support for all ten GBHA communities.”
In addition to statistics, GBHA members were also interested in perceived health concerns among community members. An ad hoc Community Assessment Subcommittee was formed to discuss ways to collect this feedback from community members. A list of community assessment subcommittee members and the mission and vision statements for the subcommittee can be found in Appendix C. This subcommittee met once per month to discuss assessment-related issues.
The subcommittee decided to show the film “Place Matters,” a 29-minute segment of the “Unnatural Causes” DVD series, to community members to stimulate thought about social determinants of health. Subcommittee members then decided to follow the film with informal conversations with community members to determine which health concerns were most pressing to residents of the GBHA communities. A list of the questions asked to community members as part of these conversations may be found in Appendix D.
The subcommittee decided that showing the DVD to established community groups would be more cost-effective than recruiting community focus group participants, and thus prioritized existing organizations throughout the GBHA to host these conversations. Community conversations were hosted by Signature Healthcare Brockton Hospital, Lincoln Technical Institute, Self-Help, Inc in collaboration with the Cape Verdean Association, the Stoughton Council on Aging, Activate Easton, Brockton Neighborhood Health Center, and the Brockton Parents’ Academy. More detailed demographic information about residents attending these sessions may be found in Appendix E. Residents of Abington, Avon, Brockton, East Bridgewater, Easton, Holbrook, Stoughton, and Whitman participated in the discussion sessions. Additionally, residents who worked or went to school in the GBHA communities but indicated that they lived in Assonet, Berkley, Bourne, Dorchester, Foxboro, Halifax, Hanson, Hyannis, Hyde Park, Kingston, Lakeville, Marshfield, Mattapan, Middleboro, New Bedford, Pembroke, Plymouth, Plympton, Quincy, Randolph, Raynham, Rockland, Sandwich, Taunton, and Weymouth participated as well. A list of the questions asked in the community impressions sessions may be found in Appendix D.
After attempting to contact various community organizations in towns outside of Brockton, the subcommittee realized that the conversations were still going to be held in largely Brockton-centric organizations. As part of the reason for holding these conversations was to gather information from GBHA communities outside of Brockton, subcommittee members brainstormed additional ways to collect data from the other communities. The subcommittee agreed to leave anonymous “question boxes” at various locations throughout the GBHA to attempt to gather additional information about health concerns in non-Brockton communities. Boxes were left at Planet Fitness in West Bridgewater, Curves gym in Whitman, the Holbrook Public Library, the Bridgewater public library, the Avon town hall, a primary care provider’s office in Abington, the Striar Branch of the Old Colony YMCA in Stoughton, and Walgreens stores in Brockton and Whitman. Surveys left in these locations may be found in Appendix D.
Key Informant Interviews
In order to obtain a more sizeable amount of information from the communities outside of Brockton, the Greater Brockton GBHA Community Health Assessment Subcommittee identified key informants in each of the nine surrounding towns to be interviewed about health concerns in those communities. Due to confidentiality constraints, individual key informants are not identified in this report. Two key informant interviews were conducted per town. To minimize bias in the information collected, efforts were made to keep the key informants consistent across towns; i.e., most key informants served the same job roles in each town and were familiar with the same health issues as other key informants. The same questions were asked of all key informants, and the same interviewer conducted all interviews. Key informant interviews were conducted from September through November, 2010. Results from the key informant interviews may be found on page 59. Questions asked to key informants may be found in Appendix F.
Interpreting the results of qualitative data, whether from key informants or from community impressions sessions, should be done with caution, as several limitations exist:
- The health concerns identified by participants in these sessions and by key informants are perceptions from individual members of these communities and should not be generalized to the larger communities in which these individuals reside.
- Community impressions sessions were conducted with existing groups around the GBHA, and not all group participants were residents of GBHA towns. These participants were not excluded from the analysis due to the fact that demographics forms were completed anonymously. Thus, some information obtained from individual participants may not necessarily relate to GBHA communities.
- Only one session was conducted in a language other than English and key informant interviews were all conducted in English; therefore, results from these sessions may not fully represent the needs of people who speak languages other than English.
- Key informants are not identified in this report due to confidentiality concerns. However, these key informants may work with specific subsets of the population, and thus health concerns of other populations may be missing from their observations.
- The oldest participant in any group was 72 and the youngest was 21; caution should be exercised when attempting to discern health care needs for people whose age falls outside of this range.
- Focus group participants may differ from people who were unable to obtain transportation to the groups or were unable to attend groups for other reasons.
Sections
SECTION 1: Demographics
| Table 1.1: Race/Ethnicity Composition, Brockton City, Other GBHA Towns, and Massachusetts Overall | |||
| Category | Brockton | GBHA towns without Brockton | State |
| Race/Ethnicity | |||
| White non-Hispanic | 56.4 | 92.0 | 81.0 |
| Black non-Hispanic | 31.1 | 4.3 | 6.0 |
| Hispanic | 8.8 | 1.9 | 7.9 |
| Asian/Pacific Islander | 3.3 | 1.6 | 4.9 |
| American Indian | 0.4 | 0.2 | 0.2 |
| Data source: MA Dept of Public Health, 2005 | |||
The GBHA is home to a diverse community of people from many different countries around the world. Within the city of Brockton, this diversity allows for spirited celebrations of cultural heritage in the form of festivals such as the Cape Verdean Festival, the Haitian Flag Raising, and the Martin Luther King Breakfast. In fact, slightly over one in four people age five and older who live in the city of Brockton speak a language other than English in the home. The city of Brockton has a distinctly different race/ethnicity composition than that of the other GBHA towns or the state, with considerably more racial and ethnic diversity (see table 1.1) Figure 1.1 shows the distribution of the total population across all towns in the GBHA. Detailed demographics for each GBHA town are available in Appendix G. Additionally, according to American Community Survey estimates from 2006-2008, approximately 24% of residents of the city of Brockton were born outside the United States, compared to 14% of people in Massachusetts overall.
While the GBHA overall resembles the state in terms of the percentages of people living below the federal poverty level, the city of Brockton has a greater percentage of people living below the poverty level than either the GBHA or state total (see figure 1.2.) In 2000, one in three individuals living in the city of Brockton reported that their family income was below 200% of the federal poverty level. An income corresponding to 200% of the poverty level was $34,100 for a family of four in 2000 and $44,100 in 2009.
Many families in the GBHA access emergency services:
- This GBHA contains two towns, Brockton and Stoughton, which are deemed “high-risk” towns by the Women, Infants, and Children (WIC) program which provides nutrition assistance and health referrals to low-income pregnant, breastfeeding, and non-breastfeeding postpartum women and children under age five found to be at nutritional risk.
- In 2009, the GBHA had 2,141 recipients of Temporary Aid to Families of Dependent Children, which is 4.3% of the MA total recipients.
Levels of educational achievement differ among the city of Brockton, the GBHA, and the state overall (see table 1.2.)
| Table 1.2: Educational Achievement for People Age 25 and Older in the GBHA | |||
| Brockton City | Other GBHATowns | State | |
| Education | |||
| Less than high school | 24.1 | 11.1 | 15.2 |
| High school graduate | 35.7 | 32.8 | 27.3 |
| Some college | 26.2 | 29.2 | 24.3 |
| College graduate plus | 14.0 | 26.9 | 33.2 |
| Data source: MA Dept of Public Health and U.S. Census 2000 | |||
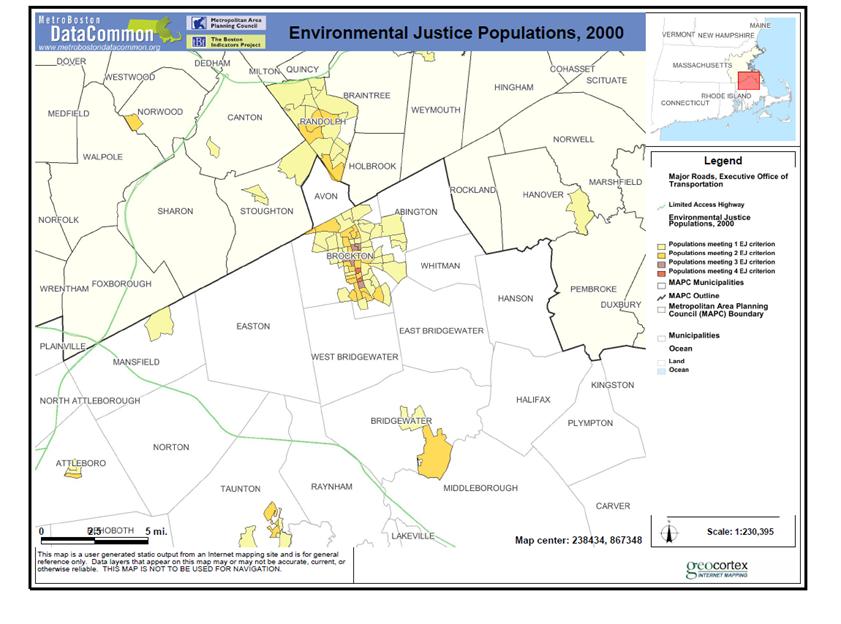
The U.S. Census Bureau has identified certain “Environmental Justice Populations,” or populations at risk of being disproportionately affected by environmental pollution. These populations are defined as “high minority, non-English speaking, low-income, and foreign-born populations.”[i] A map of these populations in the GBHA is on page 20; Brockton contains the area with the largest number and highest density of these populations in the GBHA.
In towns outside of Brockton, themes relating to poverty emerged during conversations with key informants:
- Economic situation—subtle signs of poverty;
- “I don’t know about here, but in other situations, people can be needy but not needy enough to fit the mold. And so they’re left, they’re falling between the cracks, they make just enough but it’s not enough. And that’s the tough part that you see.”
- Foreclosure;
- Expense of healthy food.
SECTION 2: Housing and Homelessness
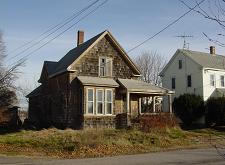
According to the most recent available data from the U.S. Census Bureau, the percentage of renters in GBHA towns was the lowest in Easton (16%) and the highest in Brockton (42%) compared to the Massachusetts state total of 35%. Much of the housing in the GBHA is older housing (see figure 2.1). Older homes may be associated with elevated lead levels in children if the housing is not properly maintained or the lead is not properly abated.[ii]
Residents’ concerns about foreclosure, as expressed in the community impressions sessions, are substantiated by the data. According to the Massachusetts Housing Partnership:
- Brockton became the community with the most distressed properties (which are properties with a foreclosure petition filed in the past year, an auction has been scheduled, or is bank-owned) in Massachusetts as of April 1, 2010 (41.8 per 1,000 housing units) pushing past Lawrence.
- Holbrook was ranked 18th in the state for the number of distressed properties and Whitman was ranked 15th in 2007.
- In addition, Abington, Whitman, Brockton, and Bridgewater all contained zip codes that were in the top 20 for homes with negative equity (purchased 2004-2008) in the fourth quarter of 2008.

Homelessness is also present in the GBHA. The United Way of Plymouth County conducts a “point-in-time” homelessness count in January of each year to assess the number of homeless individuals and families at that particular moment in time. According to the United Way, nearly all of the people are either in Brockton or from Brockton and temporarily sheltered in a nearby town. The point-in-time count of the homeless population in Plymouth County on January 27, 2010 was as follows:
- 226 households with dependent children in emergency or transitional shelters (655 total people), which represents a 74% increase over 2005;
- 192 households without dependent children in shelters;
- 23 unsheltered individuals.

Houses alongside Lake Holbrook
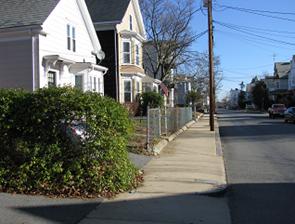
Residential neighborhood, Brockton
Additional demographics concerning the homeless population in Plymouth County from the point-in-time count include:
- 85 sheltered people and 5 unsheltered people were classified as “chronically homeless;”
- 68 sheltered people and 5 unsheltered people were classified as “severely mentally ill;”
- 106 sheltered and 4 unsheltered people were classified as having “chronic substance abuse” issues;
- 55 sheltered people were veterans;
- 1 sheltered person was living with HIV/AIDS;
- 84 sheltered people were victims of domestic violence.
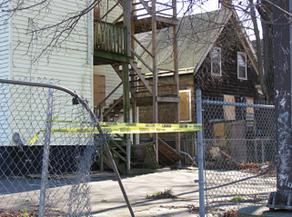
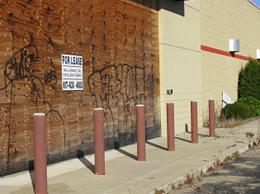
Boarded-up houses, Brockton
Boarded-up house, Stoughton
SECTION 3: Health Care Access
SECTION 4: Safety
A particular concern emerging from the community impressions sessions was the impact of violence upon the city of Brockton. When asked to list major health concerns, “violence” and “murder” were brought up at every Brockton-based session. While the age-adjusted homicide rate for GBHA towns not including Brockton was below the state rate from 2005 through 2007 (0.73 per 100,000 vs. 2.8 for the state overall), the age-adjusted mortality rate from homicide in the city of Brockton (9.2 per 100,000) was significantly higher than the state rate during the same period. The assault-related gunshot or sharp instrument injury rate for the city of Brockton was 92.4 per 100,000 in 2008, which is over three times the state rate of 30.1 per 100,000.
Such violence occurs both inside and outside of the home. Figure 4.1 shows the breakdown of where weapons-related injuries occurred in the GBHA from 2005-2007. When location of the incident was known, almost 50% of violent incidents in the GBHA occurred on the street, suggesting that residents’ concerns about safety are supported by the data.
In addition, the people injured in violent crimes may not know the offenders. According to Brockton’s Promise, of the 235 violent incidents involving a firearm in the city of Brockton in 2008,
Brockton Neighborhood Watch in the Holiday Parade, 2009 40% of offenders were known to the
victims and 60% were unknown.
Many of the violent incidents in the city involve youthful offenders. According to data from Brockton’s Promise, there were 232 drug crimes involving youthful offenders in 2007 in the city of Brockton, which represents an 18% decrease from the 2006 total of drug crimes involving youthful offenders. 52% of the total narcotics incidents in the city in 2007 involved at least one offender age 24 or younger.
When examining the data by race and ethnicity, some disparities emerge. Emergency department visits for assault-related injuries were significantly higher among non-Hispanic Black and Hispanic residents of the GBHA than among non-Hispanic White residents (see figure 4.2).
In addition to street violence, domestic violence is also an issue for residents of the GBHA. The following data were gathered from the Plymouth County District Attorney’s Office. The definition of domestic violence includes incidents between intimate partners, relatives, and in-laws (following the Abuse Prevention Law.)
In the city of Brockton, there were 3,813 reported domestic violence incidents between January 1, 2007 and December 31, 2009. Some features of domestic violence in the city of Brockton during this period include:
- 3,616 different victims and 210 repeat offenders;
- In 2009, 21% of the incidents involved no weapons, 53% involved hands or fists;
- 78% of victims were female and 22% were male. 81% of the offenders were male, 18% were female, and 1% were transgender;
- 54% of the victims were injured in some way as a result of the incident.
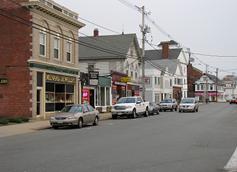
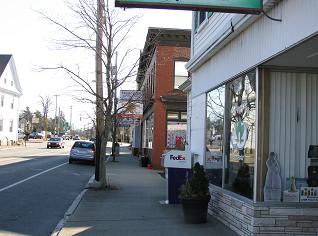
Street in Whitman Center
Domestic violence is also a concern among the other GBHA towns. Some facts about domestic violence in GBHA towns other than Brockton include:
- In Abington, there were 105 reported incidents in 2009 with 2 repeat offenders and 18 children present during domestic violence incidents;
- In Bridgewater, there were 229 reported incidents from 2007-2009 with 8 repeat offenders and children witnessing domestic violence in 37% of the instances;
- In East Bridgewater, there were 169 incidents between 2007-2009 with 9 repeat offenders and 14% of incidents were witnessed by children;
- In West Bridgewater, there were 38 reported incidents in 2009, with two repeat offenders and children witnessing 11% of the incidents;
- In Whitman, there were 82 reported incidents in 2009 with 1 repeat offender in the first half of the year and 2 repeat offenders in the second half. 51A’s were filed with the Department of Children and Families for 15 of these incidents.
SECTION 5: Substance Use and Behavioral Health
or both the city of Brockton and other GBHA towns, the rate of drug-and-alcohol-related hospital discharges were significantly higher than the state rate (see figure 5.1).
From 2005 to 2007, the age-adjusted rate of opioid-related fatal overdoses in the city of Brockton (15 per 100,000) was significantly higher than the state rate (9 per 100,000).
According to the BRFSS, a statewide survey, approximately the same percentage of GBHA residents (including Brockton) report 15 or more days of poor mental health in the past month (10%) as residents of the state overall (9%) from 2003 through 2008. Also, a similar percentage of GBHA residents reported 15 or more days feeling sad in the past month (6%) as residents of the state overall (7%) in the same time period.
When examining substance use and behavioral health data by race/ethnicity, some differences emerge (see figure 5.2).
Death certificate data from the city of Brockton shows a sharp spike in opioid-related deaths between 2006 (10) and 2007 (18).
Substance use outside of the city of Brockton is an increasing problem. In 2007, the rate of admissions for all substances to facilities funded by the Bureau of Substance Abuse Services was approximately the same in the GBHA (1658 per 100,000) as the state overall (1637 per 100,000). Figure 5.3 compares the admission rate to BSAS-funded facilities for each town in the GBHA to the state rate.
In younger age groups, some GBHA towns had higher substance use admission rates than the state overall in 2007:
- For young adults age 20-24, Avon, Whitman, Holbrook, Stoughton, East Bridgewater, Brockton, and Abington had rates of admissions for all substances higher than those in the same age group in the state overall.
- For young adults age 20-24, Abington, Avon, Bridgewater, Brockton, Stoughton, and Whitman had rates of admissions where a needle was used in the past year that were higher than the state rate for that age group.
The only community-level data on substance use and mental health in adolescents made available for the purposes of this report came from the town of Stoughton.
Figure 5.4 contains data for substance use among high school students in the town of Stoughton.
In discussions with key informants, the following themes emerged relating to substance use and behavioral health problems:
- Substance use among adolescents;
- “Percentage-wise [there aren’t] a lot, but the ones we have take a lot of our time because it’s so difficult to kick the habit, they can go into treatment, but they still come out and they’re still struggling.”
- Mental health problems among people of all ages, but particularly adolescents;
- Substance use among people of all ages;
- Alcohol abuse among adults.

Trash on the ground outside a vacant
Vacant commercial property, Brockton
SECTION 6: Maternal and Child Health

Teenage pregnancy was identified as a specific health concern by GBHA members at the beginning of the assessment. The birth rate for White non-Hispanic and Black non-Hispanic women ages 15-19 in the city of Brockton is greater than the state rate for the same ages and race/ethnicity groups (figure 6.1) Race/ethnicity disparities are also prevalent in birth rates in the city of Brockton; within the city, the birth rate for non-Hispanic Black women ages 15-19 and the birth rate for Hispanic women ages 15-19 are significantly higher than the birth rate for non-Hispanic White women ages 15-19.
Adequacy of prenatal care is also a concern for the 15-19-year-old population. A significantly lower percentage of women age 15-19 from the city of Brockton (65%) and other GBHA towns (67%) received adequate prenatal care than women of all ages living in Brockton (74%) and other GBHA towns (87%) respectively.
Castle Canyon Playground, Holbrook
Race/ethnicity disparities in adequacy of prenatal care also exist within the city and the GBHA (see figure 6.2).
From 2006-2008, the city of Brockton had a higher percentage of mothers who reported smoking during pregnancy (9.5%) than the state (7.3%). The percentage of mothers who reported smoking during pregnancy in other GBHA towns (6.7%) was approximately the same percentage as the state. A lower percentage of Black non-Hispanic women (4%) and Hispanic women (9%) in the city, however, reported smoking during pregnancy than white non-Hispanic women (19%).

Race/ethnicity disparities were observed in the percentages of infants with low birth weight, defined as less than 2500 grams (see figure 6.3).
From 2006-2008, the city of Brockton had a significantly higher infant mortality rate (8.3 per 1000) than the state overall (4.9 per 1000.) Other GBHA towns had approximately the same infant mortality rate (3.2 per 1000) as the state overall.
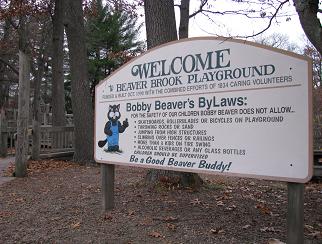
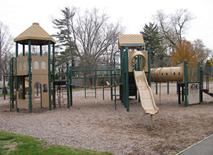
Beaver Brook Playground, Abington
Some child health indicators include:
- The area rate of lead poisoning in GBHA towns other than Brockton from 2006-2008 was 0.4% of all children screened, which was the same as the MA rate of 0.4% of all children screened. The percentage in the city of Brockton (1.3%) was significantly higher than the state. In addition, 4.1% of children screened for lead in the city of Brockton had elevated blood lead levels, which was significantly higher than the state rate of 1.8%.
- The rate of death in people less than age 20 in towns in the GBHA outside Brockton was 25.3 per 100,000 compared to 41.2 per 100,000 in MA overall (lower than the state, 2006-2008 data.) The rate of death in people under 20 in the city of Brockton was significantly higher than the state overall (70.6 per 100,000).
- For fiscal year 2007, there were 1,492 active clients using Early Intervention services in the GBHA; there were 30,640 active clients in Massachusetts overall.
- None of the communities in the GBHA have water fluoridation, which has important indications for oral health.
SECTION 7: Sexually Transmitted Infections and HIV/AIDS
The rates of HIV/AIDS and sexually transmitted infections are significantly higher in Brockton than the state. From 2005-2007, Brockton was the 10th highest city for average annual diagnosis rate of HIV in Massachusetts. In 2008, Brockton had the 11th highest rate of people living with HIV/AIDS in the state. According to the Massachusetts Department of Public Health:
- The incidence of Chlamydia was 648.6 new cases per 100,000 in 2008 in the city of Brockton and 352.7 in the GBHA, (including the city) which were both significantly higher than the state incidence rate of 268.3.
- The incidence of gonorrhea was 89.7 new cases per 100,000 in the city of Brockton and 45 in the GBHA (including Brockton) in 2008, which were both significantly higher than the state incidence rate of 31.9.
- The average annual diagnosis rate for HIV/AIDS in the city of Brockton from 2006-2008 was 20.9 per 100,000, which was twice as high as the state rate of 10.3.
- Among adolescents age 15-19, there were 252 new cases of chlamydia in the GBHA in 2008, which was significantly higher than the state rate for this age group. 204 of these new cases of Chlamydia were from the city of Brockton.
- There were 34 new cases of gonorrhea in the GBHA among adolescents age 15-19 in 2008, of which 26 cases were from the city of Brockton. The rates for these infections in the city of Brockton were 2-3 times that of the state for this age group.
The non-Hispanic Black population of Brockton has been disproportionately affected by HIV/AIDS. While 31.1% of the city’s residents identify as non-Hispanic Black according to estimates from the Massachusetts Department of Public Health, 64% of newly diagnosed cases of HIV/AIDS in Brockton were in non-Hispanic Black residents, and 55% of persons living with HIV/AIDS were non-Hispanic Black (see figure 7.1). 64% of female residents of Brockton living with HIV/AIDS are non-Hispanic Black. Figure 7.2 contains the exposure mode for newly diagnosed cases of HIV/AIDS in the city of Brockton; over half of new cases were acquired from heterosexual sex or presumed heterosexual sex.
A higher percentage of people newly diagnosed with HIV/AIDS in the city of Brockton in 2009 were foreign-born than native-born, as 39% of people newly diagnosed with HIV/AIDS in Brockton were born in the U.S.; 3% were born in Puerto Rico or a U.S. dependency, and 58% were not born in the U.S.
Of people living with HIV/AIDS in Brockton, 53% were born in the U.S. Among new cases of HIV in Brockton between 2006 and 2008, 51% were women.
SECTION 8: Risk Behaviors and Health Screening
| Table 8.1: Risk Factors in the GBHA | ||
| BrocktonGBHA Percent (95% confidence interval) | State Percent (95% confidence interval) | |
| Overweight/obese | 57.2% (52.7-61.7) | 58.2% (57.4-58.9) |
| Any leisure time physical activity, past 30 days | 75.8% (71.7-79.9) | 78.7% (78.1-79.2) |
| At least five servings of fruits/vegetables per day | 20.9% (16.8-25.0) | 26.9% (26.1-27.6) |
| Data source: McKenna M Tinsley L et al (2010). A Summary of Health Risks and Preventive Behaviors in Community Health Network Areas (GBHAs) 2007-2009. Available from: http://www.mass.gov/dph/hsp. | ||
Risk factors such as being overweight, not eating an adequate number of servings of fruits and vegetables per day, and smoking may increase risk of certain chronic diseases. Data about such behaviors is available from the Behavioral Risk Factor Surveillance System (BRFSS), which is an annual telephone survey of Massachusetts residents age 18 and older. For BRFSS data, all GBHA data includes the city of Brockton.
The GBHA has approximately the same percentage of residents who reported being overweight or obese as the state overall, approximately the same percentage of residents who reported engaging in any leisure time physical activity in the past month, and a significantly lower percentage of residents who reported that they consumed at least five servings of fruits or vegetables per day than the state overall (see table 8.1).
In addition, many towns in the GBHA have a rate of current smoking in adults higher than that of adults in the state overall. Figure 8.1 contains smoking rates for each town in the GBHA.
For overweight and obesity in children, data was available for four GBHA school districts: Bridgewater/Raynham, Brockton, Stoughton, and West Bridgewater. Please see figure 8.2 for comparisons of these school districts to the state for students in grades 4 and 10.
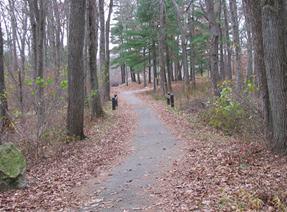
Walking trail at Ames Nowell State Park
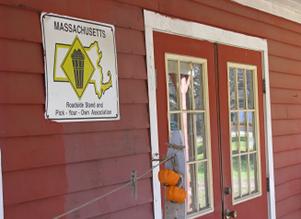
Abington Seasonal farm stand, East Bridgewater
Another important prevention measure is obtaining screening tests and preventive care in a regular fashion. Such care increases the probability of early detection of chronic diseases and avoiding preventable diseases. According to the BRFSS:
- Approximately the same percentage of people age 65 and older living in the GBHA (70%) reported that they had obtained a flu vaccination in the past year as residents of the state overall (75%);
- Approximately the same percentage of GBHA residents age 50 and older reported that they had received a colonoscopy or sigmoidoscopy in the past five years (61%) as residents of the state overall (64%);
- Approximately the same percentage of female residents of the GBHA age 40 and older (83%) reported that they had a mammogram in the past two years as female residents of the state overall in the same age group (85%);
- Approximately the same percentage of residents of the GBHA age 18 to 64 reported that they had ever had an HIV test (47%) as residents of the state overall (43%);
- Approximately the same percentage of residents of the GBHA age 18 and older reported that they had had cholesterol checked in the past five years (88%) as residents of the state overall (84%).
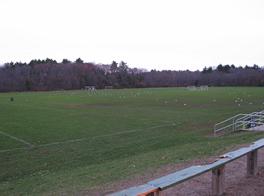
Athletic fields behind Abington High School
During conversations with key informants outside of the GBHA, the following themes emerged relating to risk behaviors for chronic illnesses:
- Childhood obesity;
- Lack of exercise both among children and adults;
- “…you figure these parents are coming home at 5:30, 6 o’clock, they’re picking the kids up from school they’re going home, making a quick dinner, and then they’re doing homework, and then it’s bed. The parents aren’t getting any time to be active.”
- Obesity in adults;
- “What I observe is a phenomenal amount of obesity, across the board.”
- Parents have no time to be active or fix healthy meals due to being stressed, working, or otherwise busy;
- “I think that’s the biggest problem. That parents are stressed, and they don’t have the time anymore, or maybe it’s a perception that they don’t have the time, because I don’t think it takes all that much to create healthy meals. But you’re running around, it’s easy to grab a box of whatever and throw it in a lunchbox, or grab takeout for dinner that’s just easy and quick.”
- Lack of sidewalks or sidewalks in poor condition;
- Children not engaging in unstructured play

Borderlands State Park, Easton
Street in East Bridgewater
SECTION 9: Chronic Illness
Examining the diagnosis and management of chronic illnesses reveals much about the state of health in a community. Problems with management of chronic illnesses may indicate lack of access to health care, inability to afford medications, or inability to understand medical providers’ instructions for managing the illness.
From 2007-2009, approximately the same percentage of residents in the GBHA (including the city of Brockton) age 18 and older reported that they had ever been diagnosed with diabetes as residents of Massachusetts overall (8%). Approximately the same percentage of GBHA residents age 18 and older reported current asthma (12%) as the state overall (10%).
When examining the management of chronic diseases, however, a different story emerges from the city and other GBHA towns (see figure 9.1).
When breaking down management of chronic diseases by race/ethnicity, we also see disparities in emergency department visit rates. The age-adjusted emergency department visit rates for asthma concerning non-Hispanic Black and Hispanic GBHA residents of all ages were over twice as high as the rate for non-Hispanic White residents (see figure 9.2). In children age 0-9, the age-specific emergency department visit rates for non-Hispanic Black and Hispanic GBHA residents were also over twice as high as the non-Hispanic White children (see figure 9.3).
The prevalence of asthma in children varies among each of the GBHA towns, according to data from the Asthma Prevention and Control Program at the Massachusetts Department of Public Health. (see figure 9.4).
Similar issues emerge when examining management of diabetes in the GBHA. The city of Brockton had significantly higher age-adjusted rates of hospitalization and emergency department visits for diabetes than the rate for the state
overall (see figure 9.5).
Disparities also exist when examining diabetes management by race/ethnicity: non-Hispanic Black residents of the GBHA (including Brockton) have a higher age-adjusted rate of hospitalization for diabetes (403 per 100,000 people) than non-Hispanic White residents (164 per 100,000). Hispanic GBHA residents (469 per 100,000) also have a significantly higher hospitalization rate than non-Hispanic White GBHA residents for diabetes.
Athletic fields, Whitman-Hanson High School
Figure 9.6 compares the rate of new cases of many types of cancer among women in the city and other GBHA towns to women in Massachusetts. Race/ethnicity disparities also exist for this health issue: the death rate from invasive breast cancer bordered upon being significantly higher in non-Hispanic Black female residents of Brockton (47.5 per 100,000) than in non-Hispanic White female residents of Brockton (21.4 per 100,000) from 2004-2008. While the rate of new cases of invasive breast cancer was significantly lower in Brockton than in the state, the mortality rate from invasive breast cancer in Brockton during the same time period (26.5 per 100,000) was similar to the state (22.9 per 100,000).
Figure 9.7 contains the rates of new cases of cancer for men in Brockton, other GBHA towns, and the state. The age-adjusted rate of prostate cancer was lower in men both in the city of Brockton and other GBHA towns from 2003-2007. The rate of invasive prostate cancer in non-Hispanic Black men in the city of Brockton, however, was significantly higher (277 per 100,000) than the rate in non-Hispanic White men in the city (98.6 per 100,000) in the same time period.
Some other chronic health conditions include:
- In the GBHA (including Brockton), the rate of new cases of Lyme disease (46.6 per 100,000) was lower than the state (62.9 per 100,000) in 2008.
- There were five new cases of tuberculosis in the city of Brockton in 2007 and three in GBHA towns outside of Brockton; there were 224 total new cases in the state overall.
- In years including 2004, 2006, and 2008, the GBHA had a greater percentage of people age 18 and older who reported five or more teeth missing due to decay or disease (19.3%) than the state (14.7%).
Many key informants in GBHA towns outside of Brockton identified the following chronic health problems in area residents:
- Childhood asthma, which tends to be better-controlled among the high-school-age population;
- Type II diabetes in adults;
- Life-threatening allergies in children;
- Lyme disease;
- Oral health problems;
- Tuberculosis—infected people from outside the US;
- Dementia and Alzheimer’s disease in older adults.
Summary of Community Discussions: What Residents Think
After viewing the “Place Matters” video, participants found that many of the issues present in the video were also present in the city of Brockton. The participants not only listed many health problems they had observed in Brockton residents, but also cited many social determinants of these health problems that they observed in the community. Below is a summary of the health problems and their social determinants that were identified by discussion participants along with a list of organizations or community resources that participants identified as helping them to live healthier lives. Eight out of the ten community impressions sessions were held in the city of Brockton; thus, the data from the community impressions sessions mainly reflects conditions in the city itself. For more detailed information about health problems in the GBHA towns other than Brockton, see page 59 for the results of the key informant interviews.
| Health Problems |
|
Multiple participants cited the following health problems that make it difficult for them to live healthy lives:
|
|
Individual residents at particular community impressions sessions also identified the following health problems:
|
Social Determinants of Health
Participants in the impressions sessions were asked to identify aspects of their environment that make it harder for them to live healthy lives in their communities. The following is a list of common themes among their responses during the discussion sessions.
| Poverty |
|
Multiple participants cited the following themes related to poverty that make it difficult for them to live healthy lives:
|
|
Individual residents at particular community impressions sessions also identified the following issues related to poverty:
|
| Housing |
|
Multiple participants cited the following themes related to housing that make it difficult for them to live healthy lives:
|
|
Individual residents at particular community impressions sessions also identified the following issues related to housing:
|
| Lack of community cohesion |
|
Multiple participants cited the following themes related to lack of community cohesion that make it difficult for them to live healthy lives:
|
|
Individual participants at particular community impressions sessions also identified the following issues related to lack of community cohesion:
|
| Mental health issues |
|
Multiple participants cited the following themes related to mental health issues that make it difficult for them to live healthy lives:
|
|
Individual residents at particular community impressions sessions also identified the following issues related to mental health issues:
|
| Neighborhood safety |
|
Multiple participants cited the following themes related to neighborhood safety that make it difficult for them to live healthy lives:
|
|
Individual residents at particular community impressions sessions also identified the following issues related to neighborhood safety:
|
| Eating unhealthy foods |
|
Multiple participants cited the following themes related to unhealthy foods that make it difficult for them to live healthy lives:
|
|
Individual residents at particular community impressions sessions also identified the following issues related to eating unhealthy foods:
|
| Physical Activity |
|
Multiple participants cited the following themes related to physical activity that make it difficult for them to live healthy lives:
|
|
Individual residents at particular community impressions sessions also identified the following issues related to physical activity:
|
| Substance Use |
|
Multiple participants cited the following themes related to substance use that make it difficult for them to live healthy lives:
|
|
Individual residents at particular community impressions sessions also identified the following issues related to substance use:
|
| Other Issues |
|
Individual residents at particular community impressions sessions also identified the following other issues:
|

Convenience store advertisement, Brockton
| Community Assets |
|
Discussion participants offered the following community assets that they have observed or experienced within the city. Such assets aid residents in living healthier lives and may seek to rectify the negative social determinants listed above. Such community assets include:
|
| How Communities Can Help |
|
Discussion participants listed some ideas for what communities could do to help residents live healthier lives.
|
Participants also listed some ideas for what community residents could do to improve conditions in Brockton.
- Call city hall if streets/sidewalks need repair;
- Attend city hall meetings to address any concerns and to be more active in decisions that are made on behalf of the community.
Summary Key of Informant Interviews: Major Perceived Health Issues in Towns Outside of Brockton
In order to obtain more information from the communities outside of Brockton, the GBHA Community Health Assessment Subcommittee identified key informants in each of the remaining GBHA towns to be interviewed about perceived health concerns in those communities. Due to confidentiality constraints, individual key informants are not identified in this report. Two key informant interviews were conducted per town. The results of these interviews are listed below.
Health Problems
Multiple key informants identified the following health concerns in GBHA communities outside of Brockton:
- Substance use among adolescents—though key informants stated it was not present in a large number of kids, it is a big problem in some;
- “Percentage-wise [there aren’t] a lot, but the ones we have take a lot of our time because it’s so difficult to kick the habit, they can go into treatment, but they still come out and they’re still struggling.”
- Mental health problems among people of all ages, but particularly adolescents;
- Substance use among people of all ages;
- Alcohol abuse among adults;
- Obesity in adults;
- “What I observe is a phenomenal amount of obesity, across the board.”
- Childhood obesity;
- Lack of exercise both among children and adults;
- “…you figure these parents are coming home at 5:30, 6 o’clock, they’re picking the kids up from school they’re going home, making a quick dinner, and then they’re doing homework, and then it’s bed. The parents aren’t getting any time to be active.”
- Type II diabetes in adults;
- Childhood asthma, which tends to be better-controlled among the high-school-age population;
- Life-threatening allergies in children;
- Lyme disease;
- Oral health problems;
- Tuberculosis—infected people from outside the US;
- Dementia and Alzheimer’s disease in older adults;
- Cardiovascular disease such as hypertension.
Individual key informants identified the following additional perceived health problems present in communities:
- Autism;
- Childhood leukemia;
- Sexually transmitted infections;
- Falls in the elderly;
- Unusually high numbers of hepatitis C cases;
- Pregnancies in teenagers and/or young adults (for example, 18 or 19-year-olds).
Social Determinants of Health
Multiple key informants identified the following conditions in their communities that made it difficult for people to maintain healthy lifestyles:
- Economic situation—subtle signs of poverty;
-
- “I don’t know about here, but in other situations, people can be needy but not needy enough to fit the mold. And so they’re left, they’re falling between the cracks, they make just enough but it’s not enough. And that’s the tough part that you see.”
- “What I am seeing right now in this economy, is a lot of people who probably actually live in very nice homes, who are maybe one step away from foreclosure, who have a great address but may not have the money to buy snacks for their kids’ school lunch.”
- Foreclosure
- Expense of healthy food
- Seniors having to make decisions about which medications to take due to inability to pay for them
-
- Lack of access to health care due to:
- High copayments (even though kids have insurance)
- Services that Medicare and Medicaid won’t cover
- People not getting insurance because tax penalty is cheaper than insurance coverage
- Difficulty navigating the health care system
- Parents have no time to be active or fix healthy meals due to being stressed, working, or otherwise busy;
- “I think that’s the biggest problem. That parents are stressed, and they don’t have the time anymore, or maybe it’s a perception that they don’t have the time, because I don’t think it takes all that much to create healthy meals. But you’re running around, it’s easy to grab a box of whatever and throw it in a lunchbox, or grab takeout for dinner that’s just easy and quick.”
- Lack of mental health counselors for adolescents, or lack of mental health providers in particular towns;
- “Sometimes you’re begging to have [a provider] take somebody, and it shouldn’t be that way. There should be more resources. Not even crisis-level resources—evaluation resources and treatment resources. It seems like the kids almost have to get into a real crisis before they’re seen readily”
- Lack of public transportation in Whitman, West Bridgewater, Abington, and Easton;
- Cuts to health education and other preventive programs due to budget shortfalls;
- “[When funding is cut] you hurt those people that really need it. If you or I don’t need that program, it doesn’t affect us. But it affects a lot of people. I think we forget that as a society.”
- Lack of dental insurance or dentists who accept MassHealth;
- “If you don’t have the money, you don’t get it done. And if the choice is between paying your rent or fixing your tooth, as long as it doesn’t hurt…”
- Lack of sidewalks or sidewalks in poor condition;
- Lack of well-care clinic due to funding cuts;
- Children not engaging in unstructured play
Individual key informants identified the following problems in their communities that made it difficult for people to stay healthy:
- Not a lot of services for 20-to-50-year olds;
- Not a lot of diversity, so kids of races/ethnicities other than non-Hispanic White might feel isolated;
- Town sports are expensive;
- Availability of substances due to more disposable income for young people;
- Domestic violence and child witnesses;
- Stranger danger—parents do not want their kids playing outside due to fear of abduction;
- Kids from a wide variety of socioeconomic backgrounds in the same school:
- “How do I put this delicately …you have a mix of socioeconomics, and it creates somewhat of a disparity that the kids at [the high school] age level especially, I think, experience. There’s kids who come into the parking lot with a brand new shiny car, and there are kids who are taking the school bus, all at the same grade level. [The] school-bus people are probably better off in many ways. So you have that as an ongoing tension [for] kids this age.”
- School cafeteria food could be healthier;
- No gym in town;
- No supermarket in one community;
- Violence spilling over from Brockton;
- Older housing and problems with absentee landlords;
- Concerns about septic systems and improperly disposed-of medications seeping into soil;
- Supermarkets with poor-quality vegetables;
- Concern about possible residual health effects from the Baird McGuire plant in Holbrook;
- Foster kids staying in temporary homes—kids do not know own home address or where food is stored in house.
| Community ResourcesKey informants from individual towns listed the resources in their communities that help them to stay healthy. Below is a list of those resources. |
| Abington“There is not one organization in this town that would turn down a child for an inability to pay” |
|
Covered bridge behind Avon Public Library
| Avon“People want to live in Avon. It’s a small town, good school system, people want to live here… it’s a nice community, presents well, easy on the eye.” |
|
| Bridgewater“I think it’s a community [where] a lot of people have been here for a long time and know each other. We do have a center of town; I think that helps.” |
|
| East Bridgewater“It seems clean and safe—I don’t see any violence, and I barely hear…sirens going off” |
|
| Easton“Every neighborhood has its own personality.” |
|
| Holbrook“It’s the little town that could!” |
|
Track, Bridgewater-Raynham High School
| Stoughton“It [is] really a nice little town!” |
|
| West Bridgewater“It’s kind of this lovely little secret nestled between Brockton and route 24, we have access to all of these urban type[s] of situations, but we really are proud of our farms and our open space.” |
|
| Whitman“I think it’s a fairly people-friendly town. We have sidewalks, we have a small downtown community, we have a park, we have two supermarkets, so we have a lot here in Whitman for a small town.” |
|
What local organizations could do to help community members maintain healthy lifestyles:
- Health promotion in town other than flu clinics;
- Funding for such projects as:
- Exercise programs at work
- Making public areas such as parks accessible for exercise
- Developing walking trails
- Increasing the amount of healthy cafeteria food available in schools
- Implementing prevention education programs in the community and holistic health programs in schools
- BMI collection in schools to send home to parents
- Hold exercise classes as fundraisers, not just bake sales;
- Develop a resource manual listing all programs and services in the area;
- “The community needs to be better at PR”—distribute literature explaining what each town department does;
- More mental health outreach and outreach to seniors;
- Maintain or increase budgets for community services such as schools and Boards of Health;
- Scholarships for children to participate in town sports;
- “I know there are some families who probably don’t do it because of the money. They don’t charge a real lot, but if you have three kids and if it’s $75 bucks per kid, $100 bucks per kid…that’s a lot of money”
- Prescription drop-off days;
- Utilize school nurses as resources for health planning activities;
- State government can move funding away from top levels of government and more to local level;
- Additional activities for kids during school vacations;
- Promote healthy eating and exercise and make healthier choices more readily available in schools (for example, in school vending machines);
- Provide assistance with transportation in towns where public transportation is difficult to access;
- Hospitals performing community outreach.
- “…outreach into the community is the way you have to go to educate or to provide whatever the service might be.”

Sheep pasture, Easton
Bridgewater Town Hall
At the end of the interview, key informants were asked if they could identify one health problem or cause of a health problem in their communities that they did not feel was adequately addressed by existing services. Below is a list of individual responses to this question. Health problems not addressed adequately by existing services:
- Physical health of 20-to-50-year olds;
- “I think the physical health of 20-to-50-year olds [is not addressed.] That population is just kind of on their own. I would like to see more nutrition and physical health attention put on that population through the resources in town. So that’s definitely a need.”
- Persistent, follow-up mental health care for adolescent psychological problems;
- Hunger;
- “I think some people are hungry and they won’t admit it. Or that they need food and they need help but they won’t admit it. So people go hungry.”
- More resources for people in need (food, insurance, paying bills);
- Stress experienced by caregivers of elderly;
- Need additional activities to promote overall wellness—for example, losing weight, encouraging walking through clubs and well-marked walking paths, lower blood pressure, also educate in the schools;
- Obesity;
- Hepatitis;
- More services for older adults that would allow them to stay in their homes longer, such as cleaning services, nursing services—many times, older adults are still living in their homes alone past the point where they’re able to care for themselves adequately;
- Teenage pregnancy—a key informant suggested having sexual education available earlier in school than for high-school-age kids;
- Resources for management of chronic illnesses such as diabetes, cardiovascular disease, and pulmonary/respiratory conditions so that people do not advance in their diseases and become hospitalized.
Result from Anonymous Question Boxes
To attempt to gain more information from community residents, GBHA assessment subcommittee members placed anonymous question boxes in various places in GBHA communities. Below are the results received from the question boxes. To see the survey instrument used for this part of the assessment, please see Appendix D.
Examples of comments classified as “miscellaneous:”
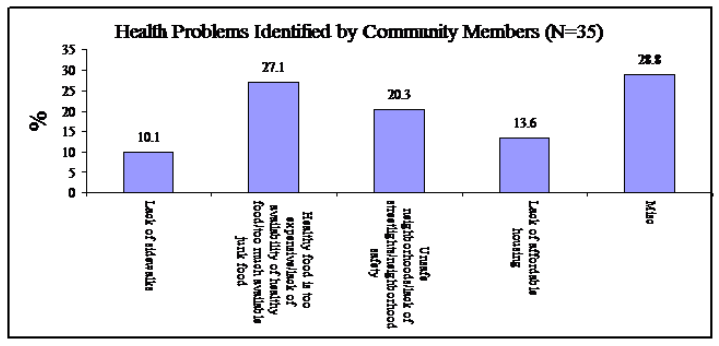
- “Fitness centers expensive”;
- “Lack of public transportation”;
- “More programs for teenagers”;
- “People would rather drink than exercise”.
Community assets listed by residents:
- “Looking out for neighbors/compassion”;
- “We recycle”;
- Food pantries;
- The YMCA;
- Walgreens—“does a great job of informing and delivering many vaccines”;
- “Maybe fruit and exercise”;
- “I’m not sure about the answer because I don’t know about programs that help people to stay healthy”;
- “Yes we have a community center”;
- “Public transportation”;
- “They do health fairs but they don’t make them really known”.
Programs and Services Available in the GBHA Catchment Area
The following is a list of area health programming, grouped by broad health topic, administered by various agencies in the GBHA catchment area. This list was compiled with the assistance of the Plymouth County Resource Manual published by the Plymouth County District Attorney’s Office in October 2009 and the Health Imperatives Service Coordination Collaborative’s Resource Guide from 2008.
General Health Services and Health Screening:
Brockton Neighborhood Health Center
Signature Healthcare Brockton Hospital
Signature Healthcare Brockton Hospital’s Women’s Health Network program/Men’s Health Partnership Care Coordination Program
Caritas Good Samaritan Hospital
Massachusetts Community Health Services
Brockton Family Planning
Insurance Services:
MassHealth
MassHealth Family Assistance
BMC Health Net
Network Health
Neighborhood Health Plan
Elder Services:
1-800-AGE-INFO hotline for information about elder services in MA
24 hour Elder Abuse Hotline
Eldercare Locator to find elderly services in your area
MassachusettsLongTermCare.org (to find long-term care facilities around MA)
Councils on Aging in each town
Ann L. Ward Congregate Home—a program of BAMSI
Dom Davies Senior Center—a program of BAMSI
Home/Health and Child Care Services
L.I.F.E. Center
Old Colony Elderly Services
Stoughton Council on Aging
Housing and Homelessness Services:
Father Bill’s/Mainspring
Housing Authorities in each town
Self-Help, Inc.
The Ruth House Teen Living
BAMSI Housing Assistance Program
Family-to-Family Project (Somerville)
HIV/AIDS Services:
Brockton Area Multi-Services, Inc. (BAMSI)
Brockton Family Planning
Brockton Neighborhood Health Center
Catholic Charities
Latin American Health Institute
Health Imperatives HIV Integration Services
Project FACE—Faith in Action for Community Education
Mental Health Services:
National Organization of Parents of Murdered Children—southeast MA chapter
MADD (for people affected by drinking and driving)
Vinfen
Department of Mental Health
South Bay Mental Health
Surviving Homicide Aftermath Program of High Point Treatment Center
Disability Services:
Disabled Persons Protection Commission
Massachusetts Rehabilitation Commission
Department of Developmental Services
CommonHealth (insurance services for disabled)
L.I.F.E. Center
BAMSI’S Developmental Disabilities Services
Brockton Supported Employment
Dial-a-BAT
Growthways
The RIDE South (services Holbrook)
South Bay Mental Health’s Early Intervention Program
Brockton Area ARC
The Tenancy Preservation Program at MainSpring Coalition for the Homeless
Substance Use Services:
Alcoholics Anonymous
Alanon Family Groups of Massachusetts
Brockton Addiction Treatment Center—a program of High Point
The Castle: Clean and Sober Teens Living Empowered, a program of High Point
High Point Treatment Center
MA Substance Abuse Helpline
South Bay Mental Health
Stairway to Recovery, a program of Latin American Health Institute
The Salvation Army Adult Rehab Center
Emergency Services
American Red Cross
Domestic Violence/Sexual Assault Crisis Services:
Victim Witness Program
SAFEPLAN (courts)
Office of the Attorney General: Victim Compensation
SANE program at Signature Healthcare Brockton Hospital
A New Day (formerly Womansplace)
Brockton Family and Community Resources
Maternal and Child Services
Department of Children and Families, Brockton office
Healthy Start
Conway Children’s Advocacy Center
Home/Health and Child Care Services
Self-Help, Inc (Head Start, Community Partnerships for Children, Meld Program)
My Turn, Inc.
South Bay Mental Health Early Intervention
Brockton Family and Community Resources
Greater Brockton Healthy Families Program
Violence Intervention Project at Brockton Family and Community Resources
The Children’s Counseling Program at A New Day (formerly Womansplace)
Schools on Wheels
Nutrition Resources
Department of Transitional Assistance—SNAP program
Project Bread
Meals on Wheels
WIC
Food Pantries
Bridgewater Town Food Pantry
Brockton Family and Community Resources
Brockton Seventh Day Adventist Church
Catholic Charities
Charity Guild
East Bridgewater Town Food Pantries
Four Square Gospel Church
Main Spring
Mt. Moriah Baptist Church
My Brother’s Keeper
Salvation Army
St. Bridget’s Church
St. Martin De Porres Catholic Church
St. Paul’s Episcopal Church
St. Vincent de Paul Society Food Pantry
Strictly Sober
Torn Veil Church of God in Christ
Trinity Baptist Church
West Bridgewater Food Pantry
Multi-Service Agencies:
Cape Verdean Association of Brockton, Inc.
Latin American Health Institute
Department of Transitional Assistance
Brockton Area Multi-Services (BAMSI)
Brockton Family and Community Resources
Catholic Charities South
Self-Help, Inc.
United Way of Greater Plymouth County
Center for Haitian American Civil Rights
South Shore Haitians United for Progress
Community Connections of Brockton
Stoughton Youth Commission/Council on Aging
Employment:
Brockton Area Private Industry Council, Inc.
CareerWorks
My Turn, Inc.
YouthBuild Coalition of Massachusetts
YouthWorks Job Program
Catholic Charities Certified Nursing Assistant Home Healh Aide Training Program
Lincoln Technical Institute—provides education with placement assistance for entry into Allied Health, Massage, and Computer Networking careers
Attire for Hire
Self-Help, Inc.
Financial Assistance (Medical or Household Expenses):
Bay State Gas, Southeastern Massachusetts
Citizens Energy Oil Heat Program
Catholic Charities South
Good Neighbor Energy Fund—a program of Salvation Army
Keyspan Energy Assistance
Massachusetts Electric/National Grid
Self-Help, Inc.
Catastrophic Illness in Children Relief Fund (Boston, medical)
EverCare (medical, surgery insurance)
Appendix A: Data Sources Used in This Report
The Massachusetts Department of Public Health offers consumers an opportunity for access to its data through the online Massachusetts Community Information Profile (MassCHIP) system. This system provides either “Instant Topics,” which are pre-analyzed reports on a variety of topics available from the MassCHIP website, or “Custom Reports”, which are user-generated data queries. The Custom Reports option was used in this assessment to generate the most up-to-date data for the GBHA.
Below are descriptions of each data set used to generate the data available in this report. The descriptions of the data sets can also be found on the MassCHIP website, www.masschip.state.ma.us.
Mortality Dataset: Deaths by cause
Births Dataset: Birth data such as number of births, prenatal care, maternal age and education, and congenital anomalies
Substance Use Dataset: Inpatient treatment admissions and admissions due to injection drug use by primary substance categories. [Note: “year” as used in this dataset refers to fiscal year]
Cancer Incidence: New cases of 28 different types of cancers
Hospital discharges: Hospital discharges by disease
Emergency visits: Hospital emergency department visits by disease
Behavioral Risk Factor Surveillance System: Health behaviors and risk factors related to areas such as AIDS, alcohol, nutrition, cancer, smoking, and weight. [A statewide, landline-only telephone survey of adults age 18 and older that takes place every calendar year and asks questions relating to health behaviors, chronic diseases, and risk factors.]
Demographics were obtained from the U.S. Census Bureau. (http://factfinder.census.gov.) The most recent nationwide census was conducted in 2000, but the bureau generates new population estimates every year. The total population estimates for each town in the GBHA are from 2009.
The “Environmental Justice Populations” map was generated using the MetroBoston DataCommon, a project of the Metropolitan Area Planning Council and the Boston Foundation. More information about this unique data source may be found at http://www.metrobostondatacommon.org/html/about.htm.
Appendix B: Common Statistical Definitions
The Asthma Prevention and Control Program at the Massachusetts Department of Public Health provides excellent, accessible explanations of commonly-used statistical terms.
95% confidence interval: “Confidence intervals help determine whether a difference between two groups is statistically significant. Since all data provided in [this report] are estimates, there is some margin of error associated with these estimates; confidence intervals give a measure of how large that margin of error is. A [95% confidence interval] means that the true value of the measure falls within the range given by the confidence interval 95% of the time. The difference between two groups is statistically significant if the 95% confidence intervals surrounding these two estimates do not overlap.
For example, if the [percentage of people with] asthma in town A is 8.3% (95% CI: 7.4-9.2%) and the [percentage of people with] asthma in town B is 9.8% (95% CI: 9.5-10.1%), the difference in asthma between towns A and B is statistically significant because the two confidence intervals do not overlap. However, if town C has a [percentage of people with asthma that is] 9.8% (95% CI: 8.8-10.8%), the difference in asthma between towns A and C is not statistically significant because these two confidence intervals do overlap. This example shows that even if two towns have the same estimated [percentages of people with] asthma (both B and C have an estimated [percentage] of 9.8%), it is the confidence interval surrounding these estimates that determines a statistically significant difference with the estimated [percentage of people with] asthma in town A.”
Age-adjusted rate:“A procedure for adjusting rates, designed to minimize the effects of differences in age distributions when comparing rates for different populations. Age-adjusted rates are usually expressed per 100,000 persons. For standardization within MassCHIP the standard population used is the 2000 US population.”6
Crude rate: Either the number of people experiencing an event per 100,000 population or the number of events (for example, treatment admissions) per 100,000 population.
Table B-1 on the next page gives formal definitions for statistical terms used in the report:
| Table B-1: Definitions of Commonly Used Statistical Terms | |
| Term | Definition |
| 95% Confidence interval | An estimated range of values that is likely to include an unknown population parameter. The true value of an estimate falls between the upper and lower limit of the interval 95% of the time. If the confidence intervals of the catchment area and the state did not overlap, then the difference was considered statistically significant. |
| Age-adjusted rate | A statistical method allowing comparisons of populations that takes into account age-distribution differences between populations. Age-adjusting takes the 2000 US population distribution and applies it to other time periods under consideration. This assures that such rates do not reflect any changes in the population age distribution. |
| Crude rate | The ratio of the number of people in which the event of interest happens in a specified time period to the size of the population who may experience this event during the same time period without adjusting for other factors such as age or sex. |
| All definitions are from the National Cancer Institute’s Glossary of Statistical Terms, which can be found at http://seer.cancer.gov/cgi-bin/glossary/glossary.pl. | |
Archival data should be interpreted with caution, as limitations exist for each data set used in the analysis. For example, one of the data sets used in this report contained treatment admissions for facilities funded by the Bureau of Substance Abuse Services. This dataset does not contain admissions to private facilities, and thus may not represent the true extent of substance use present in the area. In addition, towns have vastly different population sizes, and admission rates may fluctuate from year to year in towns with smaller populations. Where possible, three years of data were analyzed together to provide more stable estimates; however, the stability of these estimates may be substantially smaller than the stability of estimates for the state overall due to the smaller population of these areas. For more details about each data set, please see Appendix A.
Rates were calculated using the population estimates given by MassCHIP, and thus may overestimate or underestimate the true rate depending on the population changes in a town from year to year. For example, if the population of a town were actually larger than the MassCHIP estimate, then the rate would be overestimated in this report. If the population of a town were smaller than the MassCHIP estimate, then the rate would be underestimated in this report.
Archival data should also be interpreted with caution due to the fact that certain illnesses occur at small numbers at the local level, and therefore, large fluctuations in rates can occur with relatively small fluctuations in numbers of cases from year to year. For example, a town like Avon (estimated population 4,376) might have a greater fluctuation in crude treatment admission rates due to 100 additional admissions in a calendar year than Brockton (estimated population 93,527).This research should be used to indicate only where potential health problems may exist in these communities; further research is necessary to determine the extent of any potential health problems. The archival data analysis in this report contains no inferences about causality.
Appendix C: The Greater Brockton GBHA Community Health Assessment Subcomittee
In February 2010, the GBHA steering committee voted to form a subcommittee that would handle matters related to the assessment. Membership for this subcommittee was recruited from the general GBHA membership at its March meeting, and the first meeting of this subcommittee took place on March 30. The subcommittee met approximately once per month throughout the entire assessment process.
The completion of this assessment would not have been possible without the advice, guidance, and dedication of this subcommittee. Listed below are the members, mission statement, and vision statement of this subcommittee.
Greater Brockton GBHA Community Health Assessment Subcommittee Members
Linda Barros, Self-Help, Inc.
Bonnie Black, Lincoln Technical Institute
Ruth Blais, Salvation Army
Amy Bourkiche, Stoughton Youth Commission/Council on Aging
Nancy DeLuca, Signature Healthcare Brockton Hospital
Jean-Paul Despres, South Bay Mental Health
Mary Eager, Salvation Army
John Eastman, Self-Help, Inc.
Matt Elliott, Lincoln Technical Institute
Maria Evora-Rosa, Massachusetts Department of Public Health
Hilary Lovell, Signature Healthcare Brockton Hospital
Kerrin Miniutti, Lincoln Technical Institute
Robert Retalic, Lincoln Technical Institute
Robert Short, Caritas Good Samaritan Hospital
Teresa Tapper, Stoughton Youth Commission/Council on Aging
Brenda Viveiros, BMC Health Net Plan
Mission of the Greater Brockton GBHA Community Health Assessment Subcommittee:
The mission of the Greater Brockton GBHA Community Health Assessment Subcommittee is to gather information about the health and well-being of residents of the communities within the Greater Brockton GBHA and determine the areas of greatest need. We will then use this information to assist the GBHA in directing resources toward these priority areas.
Our primary goals are to:
- Collect, organize, and analyze data to share with the community;
- Engage community leaders, health and social service providers, and community members in discussions about how the environment of a community promotes or detracts from the health of its residents;
- Identify vulnerable populations within the community so the GBHA may assist them in obtaining resources to achieve an environment in which health and well-being are sustainable for all;
- Promote partnerships among community members, service providers, and community leaders to sustain a healthy environment for community residents.
Vision of the Greater Brockton GBHA Community Health Assessment Subcommittee:
The Greater Brockton GBHA Community Health Assessment Subcommittee envisions a future in which community members, service providers, and community agencies will mobilize using information about community health status and environment to work together toward a healthy, safe environment for all residents.
Appendix D: Questions for Assessment Discussion Sessions and Questions for Anonymous Question Boxes
I. Questions for discussion sessions
1. After viewing this video, which health problems can you identify in your neighborhood? What do you think causes these problems?
Prompts:
Asthma
Diabetes
Cancer
Substance use
Lack of exercise
Poor nutrition
Access to healthier foods
Obesity
Lead poisoning in children
High blood pressure
High cholesterol
Domestic violence
Street violence
Abandoned properties
2. What about the setup of your neighborhood or community makes it difficult for people to stay healthy?
Prompts:
No or poorly maintained sidewalks
Poor lighting in the streets
Violence in streets
No fresh fruit/vegetables easily available in food stores
Old/unsafe housing
Pests in housing
3. What about your neighborhood or community helps people to stay healthy?
Prompts:
Community activities such as organized sports
People in neighborhood watching out for each other
Public parks
Local clinics or doctors’ offices
School sports or activities
Community activities such as festivals (togetherness)
Local mental health organizations
Gardens
Farmers markets
Streets with proper sidewalks and lighting
4. What kinds of resources in your community help people to stay healthy? (For example: community events, health organizations, hospitals, clinics, schools, other programs?) Do you know a lot of people who use these services? Why or why not? (combine 3 and 4 if time is short)
5. What can local governments, local health organizations, or individuals in your community do to help community members to stay healthy?
6. If you could identify one health problem or cause of a health problem in your community that you don’t think is addressed well enough by existing services, what would that be? What do you think could be done about this problem?
Additional prompt/question:
Would you, as a community member, like to be involved in the process of addressing health care needs? How would you like to be involved?
II. Questions for anonymous question boxes
1. What town do you live in?
2. What about the setup of your neighborhood or community makes it difficult for people to stay healthy? (For example: lack of sidewalks, lack of streetlights, lack of public transportation, healthy food is too expensive, housing is too expensive, unsafe neighborhoods)
3. What about your neighborhood or community helps people to stay healthy?
If you’d like to help with this project, please put your name and the best way to contact you here! Your answers will still remain confidential.
_____________________________________________________________________
Thank you! Please drop your question sheet in the box when you are finished.
Appendix E: Demographic Information from Community Impressions Sessions
| Demographic Information from Community Impressions Sessions | ||||||||
| Host venue | Signature Healthcare Brockton Hospital | Lincoln Technical Institute (residents and evening students) | Cape Verdean Association (co-sponsored with Self-Help)** | Easton Children’s Museum | Stoughton Council on Aging | Brockton Neighborhood Health Center | Lincoln Technical Institute (Day students; 3 sessions) | Brockton Parents’ Academy |
| Date session held | July 14, 2010 | July 22, 2010 | August 11, 2010 | August 16, 2010 | August 16, 2010 | August 18, 2010 | August 20, 2010 | September 23, 2010 |
| Number of attendees | 14 | Approx. 50 | 10 | 5 | 6 | 20 | #1: 26#2: 21#3: 20 | 11 |
| Age range | 25-66 | 21-54 | 29-57 | 33-58 | 65-83 | 25-65 | #1: 18-63#2: 19-52#3: 19-40 | 24-72 |
| Sex distribution | 13 females, 1 male | At least 24 females, 2 males | 8 females, 2 males | 5 females | 5 females, 1 male | 18 females, 2 males | #1: 23 females, 2 males, 1 no answer#2: 19 females, 2 males#3: 18 females, 2 males | 10 females, 1 male |
**Session conducted in Cape Verdean Creole
Appendix F: Script Used for Key Informant Interviews
Thank you for taking time to talk to me today about your experiences working in (GBHA town). My name is Bonnie and I am the Community Health Analyst with the Southeast Center for Healthy Communities (SCHC), which is a program of Health Imperatives in Brockton. I am here today on behalf of the Greater Brockton Community Health Network Area (or GBHA for short.) We’re a group of health and social service organizations working to improve the health of residents of the towns in this area. Right now, our group is involved in a process called a community health assessment, which means that we’re trying to talk to groups of community members about health problems in their communities so we can find out what the most common problems are. When we collect this information from community residents and put it all together, it will help us to decide what the health priorities of the area should be. The GBHA will then be able to fund projects related to these priorities.
I want to emphasize that the discussion today will remain confidential. The results of this discussion, which will be reported thematically, will be used as part of the GBHA’s health assessment process to determine how it can best address health care needs in the area. Your name will never be shared or linked with anything that you say. I want to remind you that I am audiotaping the discussion so I can remember the important ideas you have. The tape will give us the opportunity to review what you said at a later time when we prepare a summary report.
Please tell me your first name, where you work, and how long you have worked there. Do you also live in this town?
1. Which health problems can you identify in your town? What do you think causes these problems?
Prompts:
Asthma
Diabetes
Cancer
Substance use
Lack of exercise
Poor nutrition
Access to healthier foods
Obesity
Lead poisoning in children
High blood pressure
High cholesterol
Domestic violence
Street violence
Abandoned properties
As part of this assessment process, we’re thinking about health as something more than just what we can get at a doctor’s office. Health is also something that starts in our families, in our schools and workplaces, in our playgrounds and parks, and in the air we breathe and the water we drink.* We’d like to ask you about these aspects of your community and how they may affect health outcomes.
2. What about the setup of your neighborhood or community makes it difficult for people to stay healthy?
Prompts:
No or poorly maintained sidewalks
Poor lighting in the streets
Violence in streets
No fresh fruit/vegetables easily available in food stores
Old/unsafe housing
Pests in housing
3. What about your neighborhood or community helps people to stay healthy?
Prompts:
Community activities such as organized sports
People in neighborhoods watching out for each other
Public parks
Local clinics or doctors’ offices
School sports or activities
Community activities such as festivals (togetherness)
Local mental health organizations
Gardens
Farmers markets
Streets with proper sidewalks and lighting
4. What kinds of resources in your community help people to stay healthy? (For example: community events, health organizations, hospitals, clinics, schools, other programs) Do you know a lot of people who use these services? Why or why not?
5. What can local governments, local health organizations, or individuals in your community do to help community members stay healthy? (ask as follow-up to question 4 if short on time)
6. If you could identify one health problem or cause of a health problem in your community that you don’t think is addressed well enough by existing services, what would that be? What do you think could be done about this problem?
* Copyright 2010. Robert Wood Johnson Foundation. Used with permission from the Robert Wood Johnson Foundation
Appendix G: Community Profiles, Greater Brockton GBHA Cities and Towns
| Abington | Avon | Bridgewater | Brockton | East Bridgewater | |
| Total Population (count) | 16,788 | 4,376 | 27,263 | 93,527 | 14,097 |
| Race/Ethnicity (percent) | |||||
| White non-Hispanic | 97.5 | 90.9 | 88.5 | 56.4 | 96.9 |
| Black non-Hispanic | 1.1 | 5.5 | 6.4 | 31.1 | 1.4 |
| Asian/Pacific Islander | 0.6 | 1.3 | 1.5 | 3.3 | 0.6 |
| American Indian | 0.2 | 0.4 | 0.3 | 0.4 | 0.2 |
| Hispanic | 0.7 | 1.9 | 3.3 | 8.8 | 0.8 |
| With a disability, age 5+ (%) | 17.4 | 17.5 | 12.3 | 26.7 | 18.5 |
| Education Level, population age 25 and older (percent) | |||||
| Less than 9th grade | 1.7 | 3.1 | 3.9 | 7.7 | 2.2 |
| 9-12 grade, no diploma | 8.5 | 6.3 | 9.3 | 16.4 | 9.1 |
| High school grad/GED | 35.9 | 35.2 | 29.0 | 35.7 | 37.2 |
| Some college | 20.9 | 24.4 | 18.7 | 18.9 | 20.6 |
| Associate’s degree | 11.0 | 9.9 | 9.6 | 7.3 | 8.6 |
| Bachelor’s degree | 16.0 | 14.6 | 20.6 | 9.5 | 16.3 |
| Graduate/professional degree | 6.0 | 6.6 | 9.0 | 4.4 | 6.0 |
| Born outside U.S. (percent) | 2.6 | 3.5 | 4.5 | 18.4 | 3.8 |
| Below poverty level (percent) | |||||
| Persons under 200% of poverty level | 12.7 | 20.3 | 11.9 | 33.4 | 14.5 |
| Age 65+, living alone, and below 100% poverty level | 15.4 | 9.8 | 19.3 | 22.9 | 15.2 |
Estimates from Massachusetts Dept of Public Health, 2005, U.S. Census Bureau, 2000, and U.S. Census Bureau population estimates, 2009.
| Easton | Holbrook | Stoughton | West Bridgewater | Whitman | |
| Total Population (count) | 22,987 | 10,732 | 27,154 | 6,687 | 14,188 |
| Race/Ethnicity (percent) | |||||
| White non-Hispanic | 93.1 | 88.8 | 86.2 | 96.2 | 97.3 |
| Black non-Hispanic | 2.9 | 5.8 | 8.7 | 1.5 | 1.0 |
| Asian/Pacific Islander | 2.0 | 2.1 | 3.0 | 0.9 | 0.6 |
| American Indian | 0.1 | 0.3 | 0.1 | 0.3 | 0.2 |
| Hispanic | 2.0 | 3.1 | 2.1 | 1.1 | 1.0 |
| With a disability, age 5+ (%) | 11.7 | 19.1 | 18.6 | 15.5 | 18.4 |
| Education Level, population age 25 and older (percent) | |||||
| Less than 9th grade | 1.9 | 2.6 | 4.7 | 3.1 | 1.1 |
| 9-12 grade, no diploma | 4.2 | 9.6 | 9.0 | 8.8 | 8.7 |
| High school grad/GED | 25.3 | 39.5 | 32.0 | 34.8 | 37.4 |
| Some college | 19.4 | 20.1 | 17.6 | 23.5 | 21.4 |
| Associate’s degree | 9.5 | 10.1 | 8.3 | 9.5 | 9.6 |
| Bachelor’s degree | 25.5 | 12.2 | 18.9 | 14.8 | 16.4 |
| Graduate/professional degree | 14.1 | 6.1 | 9.4 | 5.4 | 5.3 |
| Born outside U.S. (percent) | 4.6 | 5.4 | 13.7 | 3.6 | 2.2 |
| Below poverty level (percent) | |||||
| Persons under 200% of poverty level | 7.8 | 17.2 | 13.8 | 12.8 | 16.9 |
| Age 65+, living alone, and below 100% poverty level | 20.8 | 24.4 | 14.9 | 20.5 | 20.3 |
Estimates from Massachusetts Dept of Public Health, 2005, U.S. Census Bureau, 2000, and U.S. Census Bureau population estimates, 2009.
Endnotes
[1] For an explanation of age-adjusted rates, please see Appendix B on page 76.
[i] The Massachusetts Office of Geographic Information (MassGIS). “Datalayers from the 2000 U.S. Census—Enviromnental Justice Populations.” Accessed October 27, 2010, from http://www.mass.gov/mgis/cen2000_ej.htm.
[ii] Kim DY Curtis G et al (2002). Relation between housing age, housing value, and childhood blood lead levels in Jefferson County, KY. Retrieved from http://www.ncbi.nlm.nih.gov/pmc/articles/PMC1447158/ on November 2, 2010.
[iii] The U.S. Census defines a disability as follows:
The data on disability status were derived from answers to long-form questionnaire items 16 and 17.
Item 16 was a two-part question that asked about the existence of the following long-lasting conditions:
(a) blindness, deafness, or a severe vision or hearing impairment, (sensory disability) and
(b) a condition that substantially limits one or more basic physical activities such as walking, climbing stairs, reaching, lifting, or carrying (physical disability). Item 16 was asked of a sample of the population five years old and over.
Item 17 was a four-part question that asked if the individual had a physical, mental, or emotional condition lasting 6 months or more that made it difficult to perform certain activities. The four activity categories were:
(a) learning, remembering, or concentrating (mental disability);
(b) dressing, bathing, or getting around inside the home (self-care disability);
(c) going outside the home alone to shop or visit a doctor’s office (going outside the home disability); and
(d) working at a job or business (employment disability). Categories 17a and 17b were asked of a sample of the population five years old and over; 17c and 17d were asked of a sample of the population 16 years old and over.
For data products which use the items individually, the following terms are used: sensory disability for 16a, physical disability for 16b, mental disability for 17a, self-care disability for 17b, going outside the home disability for 17c, and employment disability for 17d.
For data products which use a disability status indicator, individuals were classified as having a disability if any of the following three conditions was true:
(1) they were five years old and over and had a response of “yes” to a sensory, physical, mental or self-care disability;
(2) they were 16 years old and over and had a response of “yes” to going outside the home disability; or
(3) they were 16 to 64 years old and had a response of “yes” to employment disability.
iv The state of Massachusetts definition of disability, which is used for BRFSS data, is as follows: “Disability defined as having one or more of the following conditions for at least one year: (1) impairment or health problem that limited activities or caused cognitive difficulties; (2) used special equipment or required help from others to get around; or (3) reported a disability of any kind.”
McKenna M. Tinsley L et al, (2010). A Profile of Health Among Massachusetts Adults, 2009. Retrieved December 8, 2010, from http://www.mass.gov/?pageID=eohhs2terminal&L=4&L0=Home&L1=Consumer&L2=Community+Health+and+Safety&L3=Behavioral+Risk+Factor+Surveillance&sid=Eeohhs2&b=terminalcontent&f=dph_behavioral_risk_c_statewide_rpt_present&csid=Eeohhs2
Photo Credits
Page 4: City of Brockton. Retrieved November 17, 2010, from http://www.brockton.ma.us/Departments/dwfield.aspx
Pages 5, 18, 22, 23, 24, 26, 30, 34, 35, 37, 42, 43, 44, 47, 56, 62, 65: Bonnie Andrews
Page 18: John Phelan, retrieved November 17, 2010, from http://en.wikipedia.org/wiki/File:A_field_on_the_Town_River,_West_Bridgewater_MA.jpg
Pages 23, 46: Teresa Tapper, Stoughton Youth Commission/Council on Aging
Page 26: Wikipedia user “Thunderpenguin.” Retrieved November 17, 2010, from http://en.wikipedia.org/wiki/File:BATBUS.JPG
Page 28: Used with permission from Officer Bill Healy, Brockton Police Department Crime Watch Coordinator. Retrieved November 17, 2010, from http://www.brocktonpolice.com/comed/neighborwatch.htm
Pages 44, 69: Stephanie Patton
Page 69: T.S. Custadio. Retrieved November 17, 2010, from http://en.wikipedia.org/wiki/File:Bridgewater_Town_Hall.jpg
